Will the Market Ever Stop Going Down?!
5/13/22 – Previous Close: DJIA 31,730; S&P 500 3930
Even when you expect volatility and a pullback, it still catches you by surprise – and hurts!
Although I opined in my January letter that we would have “more volatility than last year” in the stock market and to “expect at least one correction of greater than 10%” I certainly wasn’t thinking it would all happen this fast and furious! As of this writing the S&P 500 is down 18% this year and there have been more one-day 1%+ market moves (down and up) in the past four months than I can recall over such a short time span.
Are my nerves frayed? Certainly. Have we seen this before? Certainly. Depending on how long you have been a client of ours, you’ve lived through far worse than this. In recent years we’ve endured major selloffs (2007-2009 -58%; 2020 -34%) and corrections that were certainly painful to endure (2010 -16.0%, 2011 -19.4%, 2016 -14.2% and 2018 -19.8% come to mind). The good news is they all ended and rebounded to new all-time highs – every time. Where and when will this one end? No one knows for sure but there are signs that we’re likely close to a bottom. One key indicator I monitor is investor anxiety. Every measurement of investor sentiment that I follow indicates extreme fear - which is nearly always a sign of being close to a bottom. One of these measurements is at extreme levels that marked the market bottom in 2020 and another was last seen at the bottom of the 2016 selloff and 2009 at end of that bear market.
Do I have concerns? YES! Rising inflation, supply chain disruption, major war, political dysfunction, rising interest rates – just to name a few. Volatility is here to stay for a long visit. That’s why “Herb’s Three Rules of Equity Investing” of own quality, be diversified, and invest in patience are so important to follow. Assuming that “this too shall pass” (as with every other time in my 36-year career), if investors can avoid “having to sell at bad prices,” times like this may hurt your feelings but need not hurt your wallet. For clients who are systematically withdrawing funds to live on, we have strategies in place to lessen the odds of having to sell at bad prices.
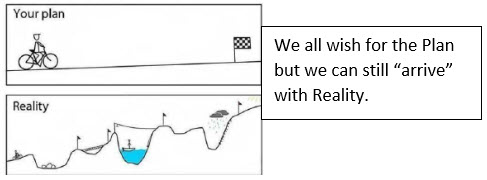
After three years with an aggregate gain of over 100%, it is not surprising to see the S&P 500 give back some of those gains. It’s not fun but not unreasonable. I’ve long said “Don’t get too excited when things go up and don’t get too depressed when things go down.” All readers of my letters have heard me “preach” about always being a five-year investor. Why? Because over five years, your odds of making money are far greater than just five months!!! Truly, having a five-year perspective is much healthier – for your wallet and your nerves! I recently came across this diagram and thought it was very timely:

One last quote from my January letter reads “When it (a correction) does happen, the media will go nuts stoking fear. Turn off the TV and keep your composure. Remember, pullbacks that unnerve some people are actually good for long-term investors. Corrections shake stocks out of ‘weak hands’ and into ‘strong hands.’” I know this doesn’t feel good but here we are and it’s time to “invest in patience.”
H. L. Ormond & Company, LLC (“HLO”) is a Registered Investment Adviser. HLO offers advisory services only to clients or prospective clients where HLO and its representatives are properly licensed or exempt from licensure.
This information is not a complete summary or statement of all available data necessary for making an investment decision and does not constitute a recommendation. Any opinions are those of HLO and are subject to change without notice based on market and other conditions. Diversification does not assure a profit or protect against a loss. Keep in mind that individuals cannot invest directly in any index. Individual investor’s results will vary. Past performance does not guarantee future results.
The information used in this market letter has been obtained from third-party sources considered to be reliable, but we do not guarantee that the material is accurate or complete. Investing involves risk and you may incur a profit or loss regardless of strategy selected.
The S&P 500 is an unmanaged index of 500 widely held stocks that is generally considered representative of the U.S. stock market. The Dow Jones Industrial Average (DJIA), commonly known as “The Dow,” is an index representing 30 stocks of companies maintained and reviewed by the editors of the Wall Street Journal. The MSCI EAFE (Europe, Australasia, and Far East) is a free float-adjusted market capitalization index that is designed to measure developed market equity performance, excluding the United States & Canada. The EAFE consists of the country indices of 22 developed nations. The Russell 2000 Index measures the performance of the 2,000 smallest companies in the Russell 3000 Index, which represent approximately 8% of the total market capitalization of the Russell 3000 Index.
Additional important disclosures about HLO may be found in our Form ADV Part 2A. For a copy, please email our firm’s Chief Compliance Officer, Sharon Dew at sharon@hlormond.com


